
Guest blog post by:
Svetlana Ristovski-Slijepcevic, MSc, PhD
Project Manager, Population and Public Health, BC Centre for Disease Control
Charito Gailling, MEd
Project Manager, Population and Public Health, BC Centre for Disease Control
Many are familiar with the adage “A picture is worth a thousand words,” the notion that an image is more effective than a verbal description at conveying information. Whether in the form of an infographic, a video, or something else equally creative, visuals are appealing because they can help us make sense of complex ideas.
Trying to figure out how to describe a complex idea simply can be a challenging process and the social determinants of health (SDH)—the conditions and systems within which people are born, grow, work, live, and age—are a good illustration of this. There have been numerous attempts to capture the SDH and their impact on the health of individuals, communities and populations, whether through the use of definitions, frameworks, infographics, videos, and other types of visually engaging presentations. The endeavour to capture SDH as a concept is important because by doing so we can support innovative planning and policy development and identify opportunities for action.
But the process of capturing a concept in a visual is a circular one—how we capture the SDH is shaped by the ways that we understand the concept itself and vice versa. Each of us has our own set of beliefs and values. As we listen and learn new concepts, we try to fit what we hear into our existing lenses. And because many of our beliefs and values are so deeply held, even the most seemingly innocuous terms can be laden with meaning.
In the past, the SDH have typically been represented as a flat, horizontal line of categories or a bulleted list of decontextualized elements. One of the most prominently used visuals of SDH in BC for the past decade has been the Canadian Medical Association’s 2009 infographic titled “What makes Canadians sick?”
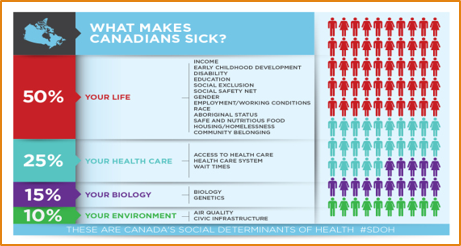
The CMA infographic has been widely used due to the reputability of its source, its Canadian focus, and easy-to-understand depiction of the concept. But limitations have also been raised and some of the limitations go above and beyond the need for an updated version of the same infographic. Anecdotally, we have heard from colleagues that the infographic lacks information/background on the weighted percentages, does not speak to the interconnections between determinants, and labels one’s “Aboriginal status” as a determinant and a negative asset.
Over the last few decades, our understandings of the SDH have expanded to recognize the complex, interrelated, and multilayered nature of determinants that work together to shape health, as well as the wider set of forces and systems that shape the conditions of our daily lives.
In glancing at SDH visuals on public health websites, we can see that while visuals still highlight lists of elements–like housing, education, employment, and income—they also offer more informative, creative and easy-to-understand entry points to the concept with both number- (maps, graphs, data) and context-oriented (narratives that can situate people in their own places and spaces) information.
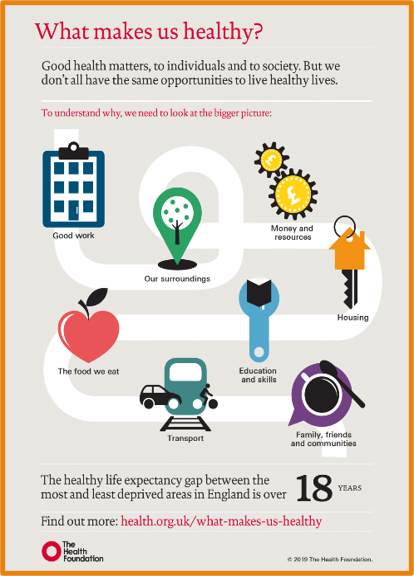
They can also subtly shift the language we use to describe the SDH. Consider, for example, the different taglines between the CMA above (What makes Canadians sick?) and the UK Health Foundation below (What makes us healthy?). We might say that this represents a minor and insignificant shift in terminology or we might say that the latter is encouraging a paradigm shift in how we work to address SDH, pointing us away from health services and toward people’s daily lives.
There are also visuals—such as the First Nations Health Council’s depiction of the social determinants of health—that point us to a more holistic view of the determinants of health, telling us that while SDH is a relatively new term, it is a concept with a much longer history, one that puts the transformation of relationships and a non-siloed way of thinking before the transformation of services.
How do we do this within the current public health parameters in BC? As others have pointed out, we will need to be open to “new principles and new ways of knowing, measuring, and governing.” We will need to reframe how we conceptualize health in a way that takes into consideration the relationship between ecological, social, and structural determinants, and commit to more inclusive public health approaches and methodologies that respectfully engage with diverse knowledge systems and ways of knowing.
As the past year and a half has poignantly highlighted the interconnected impacts from COVID-19 and climate change, public health is being challenged to consider the social, structural, and ecological determinants together. We know that structural and ecological forces are inevitably going to shape the future of our work. Our understandings of the SDH, and visuals conveying this understanding, will need to reflect this as well.